趣店集团2020年第四季度和全年业绩公告
03/29/2021
Fourth Quarter 2020 Operational Highlights:
- Number of outstanding borrowers[1] from loan book business and transaction services business as of
December 31, 2020 decreased by 14.7% to 3.5 million from 4.1 million as ofSeptember 30, 2020 as a result of the conservative and prudent strategy which the Company has deployed - Total outstanding loan balance from loan book business[2] decreased by 24.8% to RMB4.8 billion as of
December 31, 2020 , compared to the outstanding balance as ofSeptember 30, 2020 ; Total outstanding loan balance from transactions serviced on open platform decreased by 25.7% toRMB5 .1 billion as ofDecember 31, 2020 , compared to the outstanding balance as ofSeptember 30, 2020 - Amount of transactions from loan book business for this quarter decreased by 2.3% to
RMB4.8 billion from the third quarter of 2020; Amount of transactions serviced on open platform for this quarter decreased by 50.2% toRMB248.0 million from the third quarter of 2020 - Weighted average loan tenure for our loan book business was 4.5 months for this quarter, compared with 4.6 months for the third quarter of 2020; Weighted average loan tenure for transactions serviced on open platform was 6.4 months for this quarter, compared with 6.8 months for the third quarter of 2020
|
[1] Outstanding borrowers are borrowers who have outstanding loans as of a particular date, including outstanding borrowers from both loan book business and transaction services business. Transaction services business, relates to various services, including credit assessment, referral and post-origination services, provided through our open platform, which was launched in the second half of 2018. [2] Includes (i) off and on balance sheet loans directly or indirectly funded by our institutional funding partners or our own capital, net of cumulative write-offs and (ii) does not include auto loans from Dabai Auto business. |
Fourth Quarter 2020 Financial Highlights:
- Total revenues were
RMB713.6 million (US$109.4 million ), representing a decrease of 63.1% from the same period of last year - Net income increased by 427.0% year-on-year to
RMB673.9 million (US$103.3 million ), orRMB2.54 (US$0.39 ) per diluted ADS - Non-GAAP net income[3] increased by 335.6% year-on-year to
RMB683.5 million (US$104.8 million ), orRMB2.57 (US$0.39 ) per diluted ADS
Full Year 2020 Financial Highlights:
- Total revenues were
RMB3,688.0 million (US$565.2 million ) in 2020, representing a decrease of 58.3% from 2019, primarily due to the decrease in the amount of transactions
- Loan facilitation income and other related income decreased by 58.3% year-on-year to
- Transaction services fee and other related income which relate to transaction services and traffic referral services provided by the Company's open platform, was a loss of
- Financing income decreased by 40.1% to
- Net income decreased by 70.6% year-on-year to
RMB958.8 million (US$146.9 million ), orRMB3.59 (US$0.55 ) per diluted ADS - Non-GAAP net income[3] decreased by 88.6% year-on-year to
RMB382.3 million (US$58.6 million ), orRMB1.49 (US$0.23 ) per diluted ADS
|
[3] For more information on this Non-GAAP financial measure, please see the table captioned "Unaudited Reconciliation of GAAP and Non-GAAP Results" set forth at the end of this press release. |
"Despite pandemic-driven uncertainty and challenging market conditions as well as a continuously shifting regulatory environment, we were able to conclude 2020 with further improvements in our asset quality as we remained vigilant in our cash credit business operation," said Mr.
"Given that 2020 saw the impact from a weakened global economy and intricate online lending market dynamics, we upheld stringent credit risk assessments for new loans originated on our platform. At the same time, we remain dedicated to pursuing new investment opportunities. Supported by ample cash reserves and a healthy financial position, our core strengths and solid fundamentals can bolster the long-term sustainability of our overall business," said Ms.
[4] "D1 delinquency rate" is defined as (i) the total amount of principal and financing service fees that became overdue as of a specified date, divided by (ii) the total amount of principal and financing services fees that was due for repayment as of such date, in each case with respect to our loan book business and transaction services business.
Fourth Quarter Financial Results
Total revenues were
Financing income totaled
Loan facilitation income and other related income decreased by 77.6% to
Transaction services fee and other related income decreased to
Sales income increased to
Sales commission fee decreased by 73.3% to
Total operating costs and expenses decreased by 99.0% to
Cost of revenues increased by 35.4% to
Sales and marketing expenses decreased by 77.6% to
General and administrative expenses increased by 7.0% to
Research and development expenses decreased by 74.9% to
Provision for receivables and other assets reversed to
As of December 31, 2020, the total balance of outstanding principal and financing service fee receivables for on-balance sheet transactions for which any installment payment was more than 30 calendar days past due was RMB358.2 million (
The following charts display the "vintage charge-off rate." Total potential receivables at risk vintage charge-off rate refers to, with respect to on- and off-balance sheet transactions facilitated under the loan book business during a specified time period, the total potential outstanding principal balance of the transactions that are delinquent for more than 180 days up to twelve months after origination, divided by the total initial principal of the transactions facilitated in such vintage. Delinquencies may increase or decrease after such 12-month period.
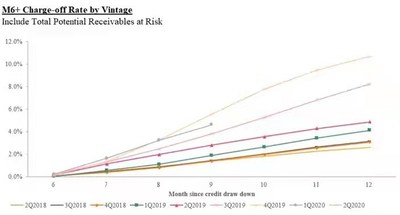
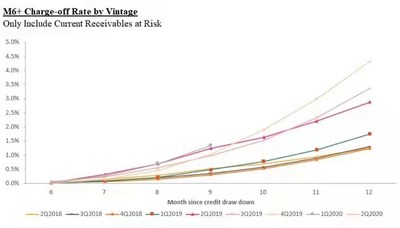
Current receivables at risk vintage charge-off rate refers to, with respect to on- and off-balance sheet transactions facilitated under the loan book business during a specified time period, the actual outstanding principal balance of the transactions that are delinquent for more than 180 days up to twelve months after origination, divided by the total initial principal of the transactions facilitated in such vintage. Delinquencies may increase or decrease after such 12-month period.
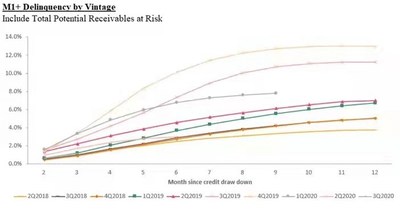
Total potential receivables at risk M1+ delinquency rate by vintage refers to, with respect to on- and off-balance sheet transactions facilitated under the loan book business during a specified time period, the total potential outstanding principal balance of the transactions that are delinquent for more than 30 days up to twelve months after origination, divided by the total initial principal of the transactions facilitated in such vintage. Delinquencies may increase or decrease after such 12-month period.
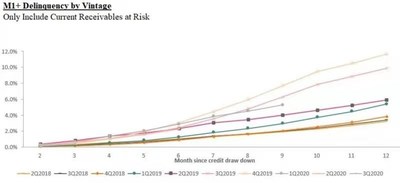
Current receivables at risk M1+ delinquency rate by vintage refers to, with respect to on- and off-balance sheet transactions facilitated under the loan book business during a specified time period, the actual outstanding principal balance of the transactions that are delinquent for more than 30 days up to twelve months after origination, divided by the total initial principal of the transactions facilitated in such vintage. Delinquencies may increase or decrease after such 12-month period.
Income from operations increased to
Net income attributable to Qudian's shareholders was RMB673.9 million (
Non-GAAP net income attributable to
Full Year 2020 Financial Results
Total revenues were
Financing income totaled
Loan facilitation income and other related income decreased by 58.3% to
Transaction services fee and other related income was a loss of
Sales income substantially increased to
Sales commission fee decreased by 77.3% to
Total operating costs and expenses decreased by 37.9% to
Cost of revenues decreased by 4.4% to
Sales and marketing expenses increased by 4.5% to
General and administrative expenses decreased by 0.1% to
Research and development expenses decreased by 16.6% to
Provision for receivables and other assets decreased by 28.1% to RMB1,641.4 million (US$251.6 million) from RMB2,283.1 million for 2019. The decrease was primarily due to the decrease in past-due on-balance sheet outstanding principal receivables compared to 2019.
Income from operations decreased by 77.5% to
Net income attributable to Qudian's shareholders decreased by 70.6% to RMB958.8 million (
Non-GAAP net income attributable to
Cash Flow
As of
For the fourth quarter of 2020, net cash provided by operating activities was RMB437.5 million (
For the full year of 2020, net cash provided by operating activities was RMB2,471.7 million (
Update on Share Repurchase and Convertible Bond Repurchase
As of the date of this release, the Company has repurchased total principal amount of convertible senior notes of
Conference Call
The Company's management will host an earnings conference call on
|
Title of Event: |
|
|
Conference ID: |
4155829 |
|
Registration link: |
For participants who wish to join the call, please complete the online registration at least 15 minutes prior to the scheduled call start time. Upon registration, participants will receive the conference call access information, including participant dial-in numbers, a Direct Event Passcode, a unique Registrant ID, and an e-mail with detailed instructions to join the conference call.
Additionally, a live and archived webcast of the conference call will be available on the Company's investor relations website at http://ir.qudian.com.
A replay of the conference call will be accessible approximately two hours after the conclusion of the live call until
|
|
+1-855-452-5696 (toll-free) / +1-646-254-3697 |
|||||
|
International: |
+61-2-8199-0299 |
|||||
|
|
800-963-117 (toll-free) / +852-3051-2780 |
|||||
|
Mainland |
400-632-2162 / 800-870-0205 (toll-free) |
|||||
|
Passcode: |
4155829 |
|||||
About
For more information, please visit http://ir.qudian.com.
Use of Non-GAAP Financial Measures
We use adjusted net income/loss, a Non-GAAP financial measure, in evaluating our operating results and for financial and operational decision-making purposes. We believe that adjusted net income/loss helps identify underlying trends in our business by excluding the impact of share-based compensation expenses, which are non-cash charges, and convertible bonds buyback income. We believe that adjusted net income/loss provides useful information about our operating results, enhances the overall understanding of our past performance and future prospects and allows for greater visibility with respect to key metrics used by our management in its financial and operational decision-making.
Adjusted net income/loss is not defined under
We mitigate these limitations by reconciling the Non-GAAP financial measure to the most comparable
For more information on this Non-GAAP financial measure, please see the table captioned "Unaudited Reconciliation of GAAP and Non-GAAP Results" set forth at the end of this press release.
Exchange Rate Information
This announcement contains translations of certain RMB amounts into
Statement Regarding Preliminary Unaudited Financial Information
The unaudited financial information set out in this earnings release is preliminary and subject to potential adjustments. Adjustments to the consolidated financial statements may be identified when audit work has been performed for the Company's year-end audit, which could result in significant differences from this preliminary unaudited financial information.
Safe Harbor Statement
This announcement contains forward-looking statements. These statements are made under the "safe harbor" provisions of the United States Private Securities Litigation Reform Act of 1995. These forward-looking statements can be identified by terminology such as "will," "expects," "anticipates," "future," "intends," "plans," "believes," "estimates" and similar statements. Among other things, the expectation of its collection efficiency and delinquency, contain forward-looking statements.
For investor and media inquiries, please contact:
Tel: +86-592-591-1711
E-mail: ir@qudian.com
Tel: +86 (10) 6508-0677
E-mail: qudian@tpg-ir.com
Tel: +1-212-481-2050
E-mail: qudian@tpg-ir.com
|
|
||||
|
Unaudited Condensed Consolidated Statements of Operations |
||||
|
Three months ended |
||||
|
(In thousands except for number |
2019 |
2020 |
||
|
of shares and per-share data) |
(Unaudited) |
(Unaudited) |
(Unaudited) |
|
|
RMB |
RMB |
US$ |
||
|
Revenues: |
||||
|
Financing income |
716,972 |
411,797 |
63,110 |
|
|
Sales commission fee |
55,481 |
14,802 |
2,269 |
|
|
Sales income |
35,906 |
161,474 |
24,747 |
|
|
Penalty fee |
13,827 |
19,261 |
2,952 |
|
|
Loan facilitation income and other related income |
460,011 |
103,163 |
15,810 |
|
|
Transaction services fee and other related income |
649,373 |
3,147 |
482 |
|
|
Total revenues |
1,931,570 |
713,644 |
109,370 |
|
|
Operating cost and expenses: |
||||
|
Cost of revenues |
(148,831) |
(201,570) |
(30,892) |
|
|
Sales and marketing |
(57,489) |
(12,880) |
(1,974) |
|
|
General and administrative |
(70,768) |
(75,714) |
(11,604) |
|
|
Research and development |
(34,288) |
(8,601) |
(1,318) |
|
|
Changes in guarantee liabilities and risk assurance |
(735,688) |
206,469 |
31,643 |
|
|
Provision for receivables and other assets |
(707,201) |
75,570 |
11,582 |
|
|
Total operating cost and expenses |
(1,754,265) |
(16,726) |
(2,563) |
|
|
Other operating income |
49,519 |
49,680 |
7,614 |
|
|
Income from operations |
226,824 |
746,598 |
114,421 |
|
|
Interest and investment income, net |
(3,095) |
6,714 |
1,029 |
|
|
Foreign exchange gain, net |
602 |
2,164 |
332 |
|
|
Other income |
958 |
369 |
57 |
|
|
Other expenses |
(6,661) |
(5,519) |
(846) |
|
|
Net income before income taxes |
218,628 |
750,326 |
114,993 |
|
|
Income tax expenses |
(90,755) |
(76,451) |
(11,717) |
|
|
Net income |
127,873 |
673,875 |
103,276 |
|
|
Net income attributable to |
127,873 |
673,875 |
103,276 |
|
|
Earnings per share for Class A and Class B |
||||
|
Basic |
0.50 |
2.66 |
0.41 |
|
|
Diluted |
0.49 |
2.54 |
0.39 |
|
|
Earnings per ADS (1 Class A ordinary |
||||
|
Basic |
0.50 |
2.66 |
0.41 |
|
|
Diluted |
0.49 |
2.54 |
0.39 |
|
|
Weighted average number of Class A and |
||||
|
Basic |
254,466,950 |
253,663,338 |
253,663,338 |
|
|
Diluted |
293,747,979 |
267,392,578 |
267,392,578 |
|
|
Other comprehensive (loss)/income: |
||||
|
Foreign currency translation adjustment |
38,464 |
(12,921) |
(1,980) |
|
|
Total comprehensive income |
166,337 |
660,954 |
101,296 |
|
|
Total comprehensive income |
166,337 |
660,954 |
101,296 |
|
|
Note: |
||||
|
|
||||
|
Unaudited Condensed Consolidated Statements of Operations |
||||
|
Year ended |
||||
|
(In thousands except for number |
2019 |
2020 |
||
|
of shares and per-share data) |
(Audited) |
(Unaudited) |
(Unaudited) |
|
|
RMB |
RMB |
US$ |
||
|
Revenues: |
||||
|
Financing income |
3,510,055 |
2,102,665 |
322,248 |
|
|
Sales commission fee |
356,812 |
80,992 |
12,413 |
|
|
Sales income |
431,946 |
610,793 |
93,608 |
|
|
Penalty fee |
44,354 |
72,235 |
11,070 |
|
|
Loan facilitation income and other related income |
2,297,413 |
957,831 |
146,794 |
|
|
Transaction services fee and other related income |
2,199,464 |
(136,542) |
(20,926) |
|
|
Total revenues |
8,840,044 |
3,687,974 |
565,207 |
|
|
Operating cost and expenses: |
||||
|
Cost of revenues |
(901,787) |
(862,354) |
(132,162) |
|
|
Sales and marketing |
(280,616) |
(293,282) |
(44,947) |
|
|
General and administrative |
(286,059) |
(285,905) |
(43,817) |
|
|
Research and development |
(204,781) |
(170,691) |
(26,160) |
|
|
Changes in guarantee liabilities and risk assurance |
(1,143,428) |
87,894 |
13,470 |
|
|
Provision for receivables and other assets |
(2,283,126) |
(1,641,362) |
(251,550) |
|
|
Total operating cost and expenses |
(5,099,797) |
(3,165,700) |
(485,166) |
|
|
Other operating income |
108,508 |
343,324 |
52,617 |
|
|
Income from operations |
3,848,755 |
865,598 |
132,658 |
|
|
Interest and investment income, net |
20,872 |
338,212 |
51,833 |
|
|
Foreign exchange (loss)/gain, net |
6,636 |
(107) |
(16) |
|
|
Other income |
24,583 |
26,358 |
4,040 |
|
|
Other expenses |
(10,324) |
(9,263) |
(1,420) |
|
|
Net income before income taxes |
3,890,522 |
1,220,798 |
187,095 |
|
|
Income tax expenses |
(626,234) |
(261,979) |
(40,150) |
|
|
Net income |
3,264,288 |
958,819 |
146,945 |
|
|
Net income attributable to |
3,264,288 |
958,819 |
146,945 |
|
|
Earnings per share for Class A and Class B |
||||
|
Basic |
11.72 |
3.78 |
0.58 |
|
|
Diluted |
10.94 |
3.59 |
0.55 |
|
|
Earnings per ADS (1 Class A ordinary s |
||||
|
Basic |
11.72 |
3.78 |
0.58 |
|
|
Diluted |
10.94 |
3.59 |
0.55 |
|
|
Weighted average number of Class A and |
||||
|
Basic |
278,531,382 |
253,658,448 |
253,658,448 |
|
|
Diluted |
300,457,711 |
274,333,161 |
274,333,161 |
|
|
Other comprehensive (loss)/income: |
||||
|
Foreign currency translation adjustment |
31,893 |
(38,455) |
(5,893) |
|
|
Total comprehensive income |
3,296,181 |
920,364 |
141,052 |
|
|
Total comprehensive income |
3,296,181 |
920,364 |
141,052 |
|
|
Note: |
||||
|
|
||||||
|
Unaudited Condensed Consolidated Balance Sheets |
||||||
|
As of |
As of |
|||||
|
(In thousands except for number |
2019 |
2020 |
||||
|
of shares and per-share data) |
(Audited) |
(Unaudited) |
(Unaudited) |
|||
|
RMB |
RMB |
US$ |
||||
|
ASSETS: |
||||||
|
Current assets: |
||||||
|
Cash and cash equivalents |
2,860,938 |
1,537,558 |
235,641 |
|||
|
Restricted cash |
1,257,649 |
135,404 |
20,752 |
|||
|
Time deposits |
231,132 |
- |
- |
|||
|
Short-term investments |
- |
5,042,314 |
772,768 |
|||
|
Short-term loan principal and financing service fee |
7,894,697 |
3,940,461 |
603,902 |
|||
|
Short-term finance lease receivables |
398,256 |
179,613 |
27,527 |
|||
|
Short-term contract assets |
2,741,914 |
92,813 |
14,224 |
|||
|
Other current assets |
1,638,905 |
762,313 |
116,830 |
|||
|
Total current assets |
17,023,491 |
11,690,476 |
1,791,644 |
|||
|
Non-current assets: |
||||||
|
Long-term loan principal and financing service fee |
424 |
- |
- |
|||
|
Long-term finance lease receivables |
239,697 |
28,771 |
4,409 |
|||
|
Operating lease right-of-use assets |
148,851 |
210,898 |
32,322 |
|||
|
Investment in equity method investee |
44,779 |
349,276 |
53,529 |
|||
|
Long-term investments |
223,158 |
209,868 |
32,164 |
|||
|
Property and equipment, net |
92,821 |
302,969 |
46,432 |
|||
|
Intangible assets |
6,803 |
8,478 |
1,299 |
|||
|
Long-term contract assets |
273,597 |
23,094 |
3,539 |
|||
|
Deferred tax assets, net |
290,285 |
154,960 |
23,749 |
|||
|
Other non-current assets |
17,698 |
419,242 |
64,252 |
|||
|
Total non-current assets |
1,338,113 |
1,707,556 |
261,695 |
|||
|
TOTAL ASSETS |
18,361,604 |
13,398,032 |
2,053,339 |
|||
|
|
||||||
|
Unaudited Condensed Consolidated Balance Sheets |
||||||
|
As of |
As of |
|||||
|
(In thousands except for number |
2019 |
2020 |
||||
|
of shares and per-share data) |
(Audited) |
(Unaudited) |
(Unaudited) |
|||
|
RMB |
RMB |
US$ |
||||
|
LIABILITIES AND SHAREHOLDERS' EQUITY |
||||||
|
Current liabilities: |
||||||
|
Short-term borrowings and interest payables |
1,049,570 |
- |
- |
|||
|
Short-term lease liabilities |
21,919 |
23,763 |
3,642 |
|||
|
Accrued expenses and other current liabilities |
718,266 |
336,790 |
51,615 |
|||
|
Guarantee liabilities and risk assurance liabilities(2) |
1,517,827 |
31,400 |
4,812 |
|||
|
Income tax payable |
589,739 |
80,656 |
12,361 |
|||
|
Total current liabilities |
3,897,321 |
472,609 |
72,430 |
|||
|
Non-current liabilities: |
||||||
|
Deferred tax liabilities, net |
178,985 |
10,923 |
1,674 |
|||
|
Convertible senior notes |
2,339,552 |
822,005 |
125,978 |
|||
|
Long-term lease liabilities |
21,694 |
80,236 |
12,297 |
|||
|
Long-term borrowings and interest payables |
- |
102,415 |
15,696 |
|||
|
Total non-current liabilities |
2,540,231 |
1,015,579 |
155,645 |
|||
|
Total liabilities |
6,437,552 |
1,488,188 |
228,075 |
|||
|
Shareholders' equity: |
||||||
|
Class A Ordinary shares |
131 |
132 |
20 |
|||
|
Class B Ordinary shares |
44 |
44 |
7 |
|||
|
Treasury shares |
(362,130) |
(371,551) |
(56,943) |
|||
|
Additional paid-in capital |
3,967,733 |
4,007,260 |
614,139 |
|||
|
Accumulated other comprehensive loss |
(12,965) |
(51,420) |
(7,880) |
|||
|
Non-controlling interests |
- |
10,000 |
1,533 |
|||
|
Retained earnings |
8,331,239 |
8,315,379 |
1,274,388 |
|||
|
Total shareholders' equity |
11,924,052 |
11,909,844 |
1,825,264 |
|||
|
TOTAL LIABILITIES AND SHAREHOLDERS' |
18,361,604 |
13,398,032 |
2,053,339 |
|||
|
Note: |
||||||
|
|
|||||||
|
Unaudited Reconciliation of GAAP And Non-GAAP Results |
|||||||
|
Three months ended |
|||||||
|
2019 |
2020 |
||||||
|
(In thousands except for number |
(Unaudited) |
(Unaudited) |
(Unaudited) |
||||
|
of shares and per-share data) |
RMB |
RMB |
US$ |
||||
|
Total net income attributable to |
127,873 |
673,875 |
103,276 |
||||
|
Add: Share-based compensation expenses |
29,042 |
5,050 |
774 |
||||
|
Less: Convertible bonds buyback (loss)/income |
- |
(4,586) |
(703) |
||||
|
Non-GAAP net income attributable to |
156,915 |
683,511 |
104,753 |
||||
|
Non-GAAP net income per share—basic |
0.62 |
2.69 |
0.41 |
||||
|
Non-GAAP net income per share—diluted |
0.59 |
2.57 |
0.39 |
||||
|
Weighted average shares outstanding—basic |
254,466,950 |
253,663,388 |
253,663,388 |
||||
|
Weighted average shares outstanding—diluted |
293,747,979 |
267,392,578 |
267,392,578 |
||||
|
|
|||||||
|
Unaudited Reconciliation of GAAP And Non-GAAP Results |
|||||||
|
Year ended |
|||||||
|
2019 |
2020 |
||||||
|
(In thousands except for number |
(Audited) |
(Unaudited) |
(Unaudited) |
||||
|
of shares and per-share data) |
RMB |
RMB |
US$ |
||||
|
Total net income attributable to |
3,264,288 |
958,819 |
146,945 |
||||
|
Add: Share-based compensation expenses |
87,299 |
45,634 |
6,994 |
||||
|
Less: Convertible bonds buyback income |
- |
622,109 |
95,342 |
||||
|
Non-GAAP net income attributable to |
3,351,587 |
382,344 |
58,597 |
||||
|
Non-GAAP net income per share—basic |
12.03 |
1.51 |
0.23 |
||||
|
Non-GAAP net income per share—diluted |
11.23 |
1.49 |
0.23 |
||||
|
Weighted average shares outstanding—basic |
278,531,382 |
253,658,448 |
253,658,448 |
||||
|
Weighted average shares outstanding—diluted |
300,457,711 |
274,333,161 |
274,333,161 |
||||
![]() View original content to download multimedia:http://www.prnewswire.com/news-releases/qudian-inc-reports-fourth-quarter-and-full-year-2020-unaudited-financial-results-301257371.html
View original content to download multimedia:http://www.prnewswire.com/news-releases/qudian-inc-reports-fourth-quarter-and-full-year-2020-unaudited-financial-results-301257371.html
SOURCE